How DORA, SPACE and DevEx connect?
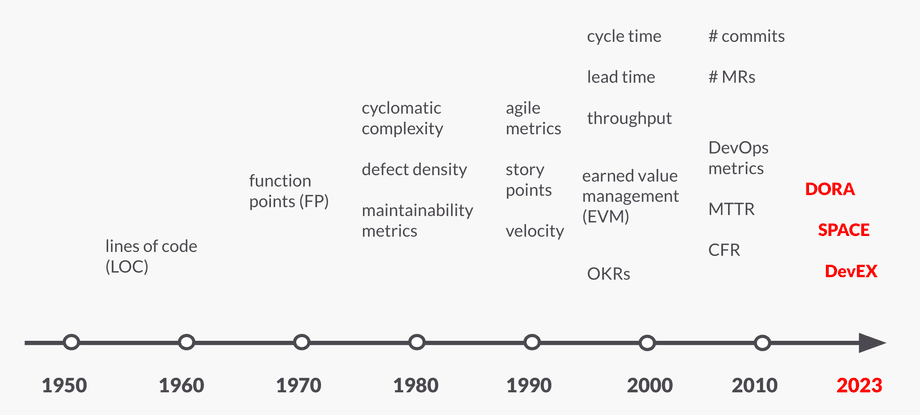
In the 1950s the industry standard of measuring productivity was monitoring lines of code (LOC). The more lines were delivered, the more productive the team was. In 2023 it’s quite obvious how this metric is flawed, but that wasn’t the case back then for a couple of reasons:
- Programs were way smaller, rarely exceeding 1000 lines. These days it may be a single (big, but still single) pull request. With larger programs issues with LoC started to appear more often.
- We didn’t have so many programming languages in the 1950s 😉. There is a big difference in the amount of boilerplate code between modern languages, and they allow you to write the same functionality in different ways. With a smaller number of languages and paradigms, LoC seemed more pragmatic than it is now.
- Finally, there was no awareness of refactoring, keeping things DRY and that reducing lines of code may be a beneficial thing.
Everything changed when programs (and teams) became bigger. For 70 years we’ve been looking at how to effectively measure software productivity and this goal still eludes us, with every metric displaying its dark side and showing up terrible ways how people game it, using Campbell’s law, but additionally - that metric simply cannot tell the whole truth.
Beginning of DORA and Accelerate
That was serious to the point, where Martin Fowler wrote an article in 2003 named “CannotMeasureProductivity” explaining multiple different problems with the current approach. Ten years later he tweeted this problem still holds.
But in the next decade, between 2013 and 2023, a lot has happened. Dr Nicole Forsgren, Gene Kim (author of “The Phoenix Project”) and Jez Humble (author of “Continuous Delivery”) worked together under blessings from puppet labs to deliver 2014 and 2015 “state of DevOps report”. It was a pleasant cooperation, and Dr Forsgren has found that during research they are constantly being asked similar questions related to productivity, and she believed that they had an answer. As a result, in 2016 they found a startup named DORA, which is a shortcut for “DevOps Research & Assessment”. Some of you may already feel surprised since you knew DORA as a term concerning the famous “Four metrics”. We’ll get into that.
After two more reports (now with “DORA” and puppet separately on the front page), something magical has happened - DORA released a book which connected the metrics, problems and solutions from the past four reports into a well-rounded book - Accelerate. The reception was amazing - everyone in IT was talking about it. Quotes like this started to appear:
The person who didn’t read this book will be replaced by the one, who did ~ Thomas A. Limoncelli
And the same year, DORA has been acquired by Google! 👏
There was a lot in the book but I’ll provide the most important findings from my point of view:
- Every year, the elite performers in the industry become better and better, while low performers keep staying further behind - the gap constantly increases.
- Elite performers are not afraid of measuring their productivity and they constantly look for never-ending improvements.
- Elite performers are not only producing higher quality solutions which are more stable, but they are also producing them faster; being fast is what allows them to be more stable.
- There were 24 capabilities found (technical, process or culture related) which are the most commonly shared across the elite performers.
- It’s enough just to measure 4 result-focused metrics to categorize an organization as an elite, medium or low performer.
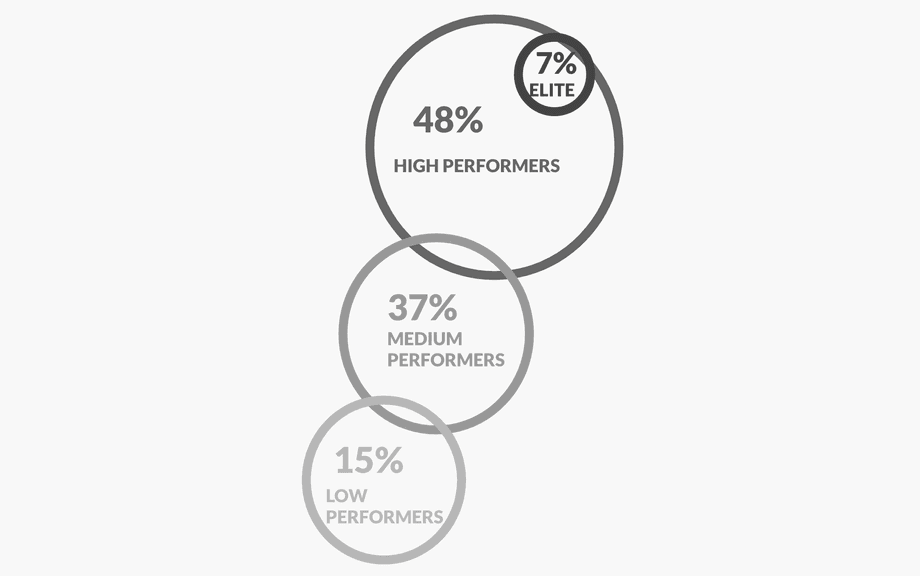
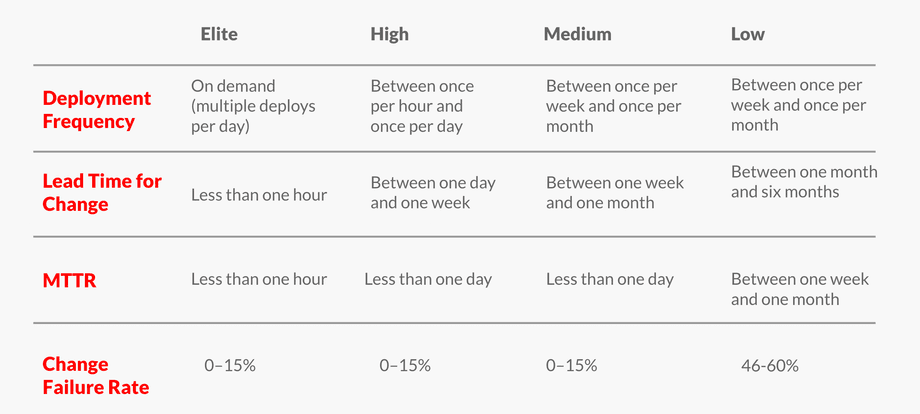
Based on the metrics and 23 000 survey responses they were capable of grouping different organizations of different domains and sizes (from small startups to huge enterprises) into categories:
And the famous four metrics they presented in 2018 (this is what often people understand as “DORA”) looked like this:
With that, in 2018 it became possible to measure the performance of your entire organization in a pretty simple way. It was still unknown how to measure it on the individual level, but part of the answer was delivered.
What I covered so far is probably in the first 30 pages of the Accelerate book. The rest of the ~200 pages cover 24 capabilities which explain how to get better and increase your chances of becoming an elite performer - I’ll cover this in the next section.
DORA in 2023
Since 2018, the number of survey responses gathered by DORA increased to 33 000 making it the biggest IT research of the industry.
Metrics proved still to be useful, although a couple of caveats have been noticed here and there (by the industry which was incorrectly measuring it, because in the book it was explained like this from the start):
- The deployment number needs to come from your most important, business-critical system (primary application), instead of a small, barely used internal app with a small risk.
- The lead time references to the time from the code committed to the code successfully running on production, not a time since the idea was created till it was released.
- Change fail percentage requires an internal definition of what we understand as a “degraded service” - sometimes it may be a bug, sometimes an incident, sometimes something in between.
DORA wanted to help organizations claiming that these things are difficult to measure, so now on their website you can find a DevOps quick check survey and additionally they even released FourKeys on GitHub which allows you to obtain nice-looking dashboards faster and more reliably.
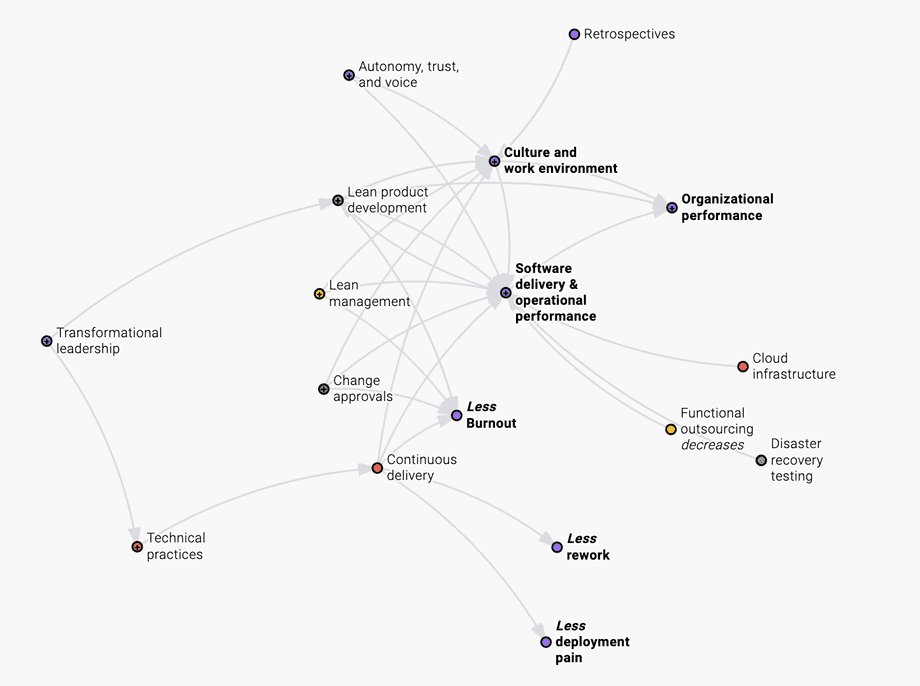
Additionally, we have more capabilities now (28) and they are all visible on the website as a beautiful, dynamic graph with every capability explained, and documented on how to implement it. They split into technical, process and cultural capabilities and they are constantly being updated and refreshed to match the situation in 2023. They are so large that each of them deserves its blog post! 😃
There are also some surprises in the latest 2022 report:
- The four metrics have become five metrics and now they are called “Software delivery and operational performance (SDO)” - I guess this may be an action to move away from people calling them simply “DORA” 😉. The new metric is called “Reliability”.
- Additionally, the split between Elite (N/A), High (11%), Medium (69%) and Low (19%) performers is different than the previous results and I don’t think it’s well explained - at least I couldn’t fully understand why it looks like this… 🤷
Either way, DORA website contains a lot of precious knowledge and it’s worth investigating if you want the entire organization to become better and more productive. However, in 2023 it still won’t help us in measuring individual software engineers’ performance.
SPACE
This is where another framework comes into the game - SPACE. At the beginning of 2021, a blog post from GitHub went viral on a couple of Reddit threads. It was called “Measuring enterprise developer productivity” and it was explaining a paper written (once again!) by Dr Nicole Forsgren (amongst other authors) titled “The SPACE of Developer Productivity - There’s more to it than you think.”. GitHub announced it because she was working for them at that time.
The paper starts from debunking the myths surrounding the aspect of measuring software engineering productivity, which aligns very nicely with what industries have noticed throughout the years:
- Myth #1: Productivity is all about developer activity. Imagine a spike in the number of merge requests - normally it used to be around 10 per week for this team, but now it’s 15. The activity metrics alone do not reveal if they come from a good source (sense of flow, good understanding of the team goal, high process automation) or a bad source (patching errors or QA problems, workarounds, corrections of misunderstanding, deadlines causing pressure, necessity to update multiple repositories to do a simple thing), so they should never be used in isolation either to reward or to penalize developers.
- Myth #2: Productivity is only about individual performance. Nobody likes brilliant jerks - programming is a team sport, and a team requires team-related activities - sometimes sacrificing your time for others. A typical example would be peer code reviews, or answering questions of more junior engineers - if you’d ignore them to deliver more of your work, that may seem to increase your performance, but at the cost of the team’s productivity.
- Myth #3: One productivity metric can tell you everything. The most important outcome of the entire SPACE framework is that there is no single metric which allows you to measure software productivity fully and correctly. Just as Martin Fowler said in 2003… but it doesn’t mean that we cannot measure productivity!
- Myth #4: Productivity metrics are useful only for managers. The paper proves with research that feeling productive brings satisfaction and a sense of fulfilment, which further improves performance and motivation. It’s not only useful for managers.
- Myth #5: Productivity is only about engineering systems and developer tools. New tools certainly can help with productivity (hey ChatGPT, I’m looking at you! 😉) but there is a lot of “invisible work” (often connected with communication) which is not being measured and it’s necessary to get the job done. There is a famous article on the topic, called “being Glue”.
SPACE answers all of the above problems by providing a framework which orders you to measure productivity from multiple perspectives, or dimensions. Additionally, each dimension is being measured on different levels or scopes (individual, team, or organization). It looks like this (together with examples of metrics from the paper):
- S is for Satisfaction and well-being.
- Individual level - satisfaction survey, or asking about the perception/happiness around a specific topic (like code reviews).
- Team level - retention or satisfaction survey.
- Organization level - happiness about CI/CD pipeline.
- P is for Performance.
- Individual level - code review velocity.
- Team level - velocity points.
- Organization level - code review acceptance rate.
- A is for Activity.
- Individual level - number of commits.
- Team level - story points completed.
- Organization level - frequency of deployments.
- C is for Communication and collaboration.
- Individual level - quality score of code review thoughtfulness.
- Team level - the quality of meetings.
- Organization level - discoverability (quality of documentation)
- E is for Efficiency and flow.
- Individual level - lack of interruptions.
- Team level - handoffs.
- Organization level - code review timing.
It is recommended not to measure too many things (just select what makes the most sense for you) and it is being emphasized that you don’t need to cover all of the dimensions (but you should cover at least three, and pick them in a way to counterbalance each other to give you the complete view). It is also considered to be the best practice not to avoid survey data and to keep in mind that what the company measures is considered to be a signal to employees on what’s important.
All in all, SPACE seems to be a framework which has an answer on how to build a productivity measurement system for your organization and on an individual level! I like two quotes from Dr Forsgren:
”(…) a team where productivity = lines of code alone is very different from a team where productivity = lines of code AND code review quality AND customer satisfaction.
And I think she is very, very right. The paper is easy to read and short and I need to say that I’m feeling very confident in trying to measure multiple dimensions in the upcoming quarters.
DevEx
Just a couple of months ago another interesting paper was released called “DevEx: What Actually Drives Productivity”. For the third time, we have Dr Nicole Forsgren on the authors’ list, also with professor Margaret-Anne Storey (she also worked on SPACE) and Abi Noda, CEO of DX startup working on a “Developer Experience Insights Platform”. As you see, it’s a similar group of authors - so in my mind, all of these ideas should complement each other.
When I was reading it, I noticed that multiple times another paper was mentioned, written by two of the above authors in late 2021, called “An Actionable Framework for Understanding and Improving Developer Experience”. I quickly noticed in the methodology section that it was constructed based on interviews with 21 software engineers, which immediately drastically reduced my trust towards DevEx framework. The number seemed too small compared to DORA and I felt it may be a marketing strategy of the new startup, trying to repeat the DORA success… However, I continued to read both of them and although I was much more impressed by SPACE, I still think it’s a high-quality idea worth investing into. So let’s dive in.
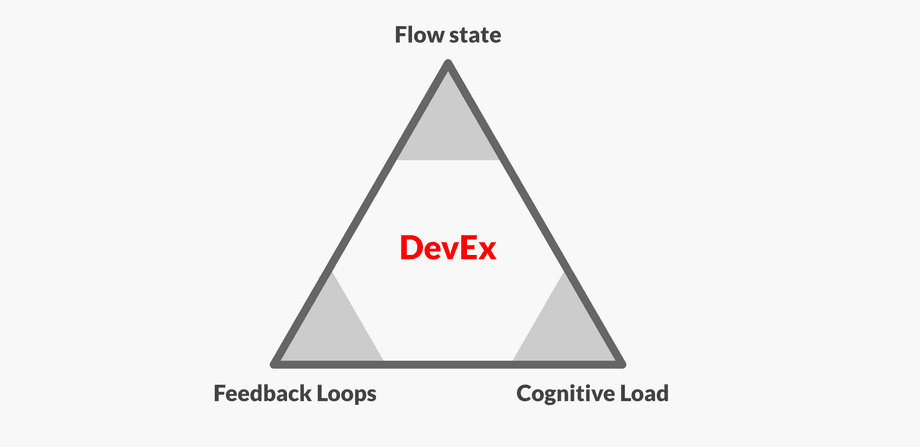
The whole concept can be nicely summarized by the triangle below:
The entire triangle describes the most important aspects taken from the mentioned research in 2021 which found the 25 elements affecting overall developer experience. The main three angles are:
- Feedback loops. As engineers, we constantly require quick feedback loops to make swift decisions. What comes to our mind? Code compilation time, how long automated tests are running, and how flaky they are. However, it’s also a human aspect: waiting for others to reply, make their judgement, review our code, and give us approval. The shortest these feedback loops are, the easier it is for us to get our job done.
- Cognitive load. A concept described very deeply in Team Topologies, but in short: we often make our environment unnecessarily complicated. Starting from the code itself (too big classes or the contrary - too big class proliferation, too many variables, too much-tangled logic), going through too many tools, lack of documentation, tribal knowledge, lack of standards, technical debt… there are many ways how we can make it harder for us to work.
- Flow state. We all know what flow is - this is this weird situation when the entire day ends, our spouse tells us to go to sleep, and we still feel we have the energy and motivation to try a couple more things before bed. Interruptions, roadblocks, lack of tools or access, lack of understanding or a proper challenge may lead to less flow in our work. I think leaders in the industry have noticed already that creating an environment which supports entering a flow state is beneficial for everyone.
What DevEx does great is explaining how we need to connect workflows and system metrics with perceptual data (human opinions, surveys). There is a natural tendency for engineers to trust the objective system data, base judgement on it and look at any opinions as weak, flawed, sparkled with emotions and probably - a bunch of lies. This is not always true. If you’d ask your engineers if they think code review experience is good or bad, why would they lie? Dr Nicole said in one of the podcasts another great quote:
“It is well known that software engineers don’t leave jobs, they leave managers. But they also leave systems.”
It’s interesting how often we don’t notice that as managers, because we simply trust our data which doesn’t capture that something is wrong (due to lack of metric coverage, edge cases, topics that we cannot measure and so on). We don’t contrast the fast, swift signal from the system with slower but less error-prone human signal - and we should. Because ” whenever your system data and survey data disagree, survey data wins”.
The paper also describes the topic of Psychometrics as a field of science that we need to dig into to construct higher-quality surveys to get perceptual data. It’s very easy to fail at this task and either you won’t collect enough responses or you’ll notice people experiencing survey fatigue. I liked the idea of transactional survey - for example - you run a quick, optional open question with the engineer whenever their build fails, so you can gather small nuggets of data next to the point of friction.
So how DevEx suggests to gather data in their triangle angle? Examples from the paper below:
- Feedback loops - measure deployment lead time and ask people about a satisfaction level from the time and effort it takes to deploy a change to production.
- Cognitive load - measure the frequency of documentation improvements and ask people about ease of understanding the documentation.
- Flow state - measure the number of blocks of time without meetings or interruptions, and ask people about their perceived ability to focus and avoid interruptions.
How all of that connects together
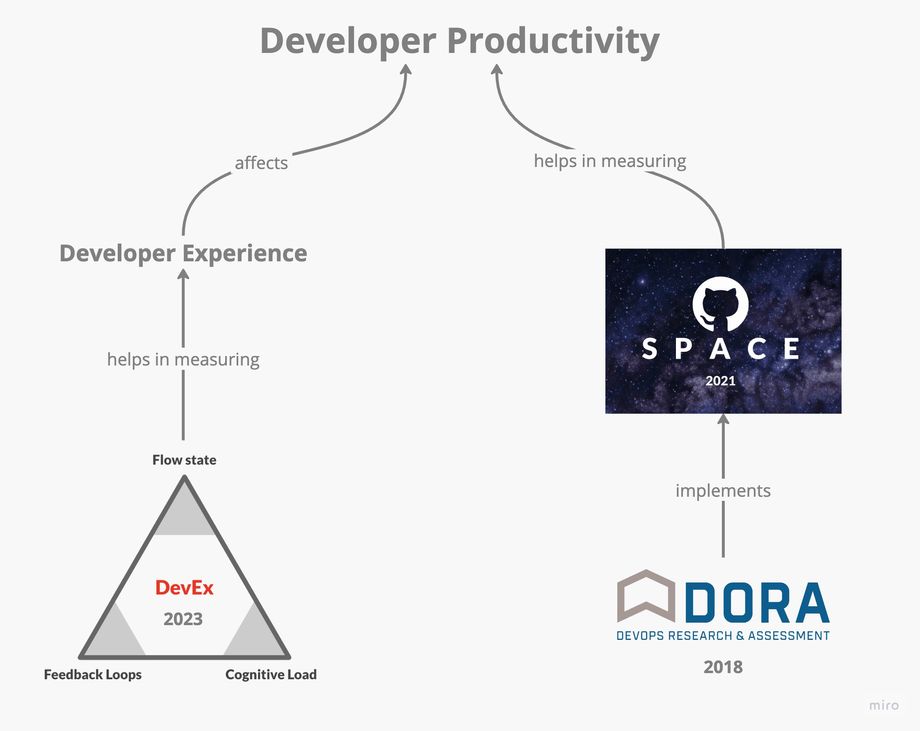
I was looking into articles, podcasts or videos to explain that topic but unfortunately, I mostly heard the advertising of the last framework (depending on the release date of the material it was a different framework 😃). I expected that since the same people are involved in many of these frameworks, they will more clearly explain how to use all of these frameworks together, or maybe we should treat them as alternatives. My perception is drawn below:
The close reply to Martin Fowler’s question (can we measure productivity?) is being answered in my mind by SPACE. It’s not possible to do by a single metric, but by contrasting multiple dimensions we can draft a function that suits our organization’s needs and won’t be easy to game. Time will ultimately tell if this is a better approach, but SPACE adoption so far is still pretty low, most probably for the reasons explained in DevEx related to engineers’ mistrust towards opinionated data.
We know that many elements of software engineering productivity are affected by overall developer experience - so by improving the latter, we should improve productivity too. Additionally, SPACE measures some of the elements affected by developer experience, so by improving in DevEx I’d assume we should also get better in S (Satisfaction) in SPACE. It’s interesting how SPACE and DevEx both emphasize the importance of perceptual metrics being measured and multidimensional measurement. If we will adopt this thinking, we may finally get over the problem of mistrust towards productivity measurement. Both SPACE and DevEX are pretty similar approaches but attack the problem of productivity from a bit different angles. My other take is that DevEx is a lockpick to strongly affect S and E from SPACE.
I had a problem with where to place DORA, but Dr Nicole said in one of the podcasts that in her understanding, DORA is an implementation of SPACE, together with a set of practices and recommendations on how to get better. I think it makes sense, because the 28 capabilities listed by DORA will improve all of the SPACE dimensions. However, I’m not sure if the 5 key metrics measure 3 distinct dimensions as SPACE suggests (to me they are mostly P and A). All in all, SPACE and DevEX are great at measuring where the problem is, while DORA research may help you in improving on them through implementing capabilities.
What’s also important is that DORA is way, way more researched than SPACE and DevEX. The difference in survey data is huge. Additionally, implementing SPACE or DevEX may be “fairly” simple if you already have system data in place and you’re willing to dig into psychometrics, compared to capabilities introduced in DORA - these may be multi-quarter initiatives.
Summary
For over 70 years, IT has had trouble measuring software engineering performance.
- In 2018, DORA startup released a book called “Accelerate” based on 23 000 survey responses, which announced 4-key metrics to measure organizational productivity and categorize your company amongst elite, high, medium or low performers. Additionally, they’ve released 24 capabilities explaining how to become better.
- In 2023, DORA is now acquired by Google and gathered 33 000 responses to its research. We how now 5 key metrics and 28 capabilities drawn on a beautiful website. However, DORA didn’t provide measures for individual productivity, they always focused on organization-level metrics.
- In 2021, SPACE was released which debunked a common set of myths regarding measuring productivity and suggested measuring it from multiple angles (or dimensions) and on multiple levels (including individual levels).
- In 2023, DevEX was released which focused on improving Developer Experience, which affects positively productivity. It focused on three different angles and emphasized strongly to mix system-level metrics with perceptual metrics.
- It’s important to remember that all three frameworks have a similar set of authors related to them.
- SPACE seems to be the answer to measuring software engineering productivity if the time will confirm it. DORA is an implementation of SPACE as the author says, and DevEX is a way to measure & improve developer experience, which improves developer productivity.
- Implementing SPACE or DevEX may be simpler and faster than implementing many DORA capabilities.
I know it was a low this month - but I hope it was useful! 😉
Update after 12 months
Although many of the benefits listed above hold still (SPACE or DevEx dimensions, mixing objective & subjective metrics), I don’t believe they help in measuring individual performance and they were not designed to do so.

